Graphical User Interface (GUI)#
This section provides an overview of how to use the Graphical User Interface (GUI) provided by the library. The GUI allows users to interact with the library’s functionality in a user-friendly way.
Getting Started#
Installation#
Follow the steps below to install the library along with its GUI dependencies.
Install the library using
pip install interpreTSor your preferred package manager.Install library from source by cloning the repository and running
pip install .in the root directory.
Launching the GUI#
Once installed, you can launch the GUI by navigating to the GUI directory,:
cd interpreTS/core/gui and
streamlit run gui.py.
After executing the command, your default browser will open and display the GUI.
UI Overview#
Below is an overview of the main interface, highlighting each region’s purpose.
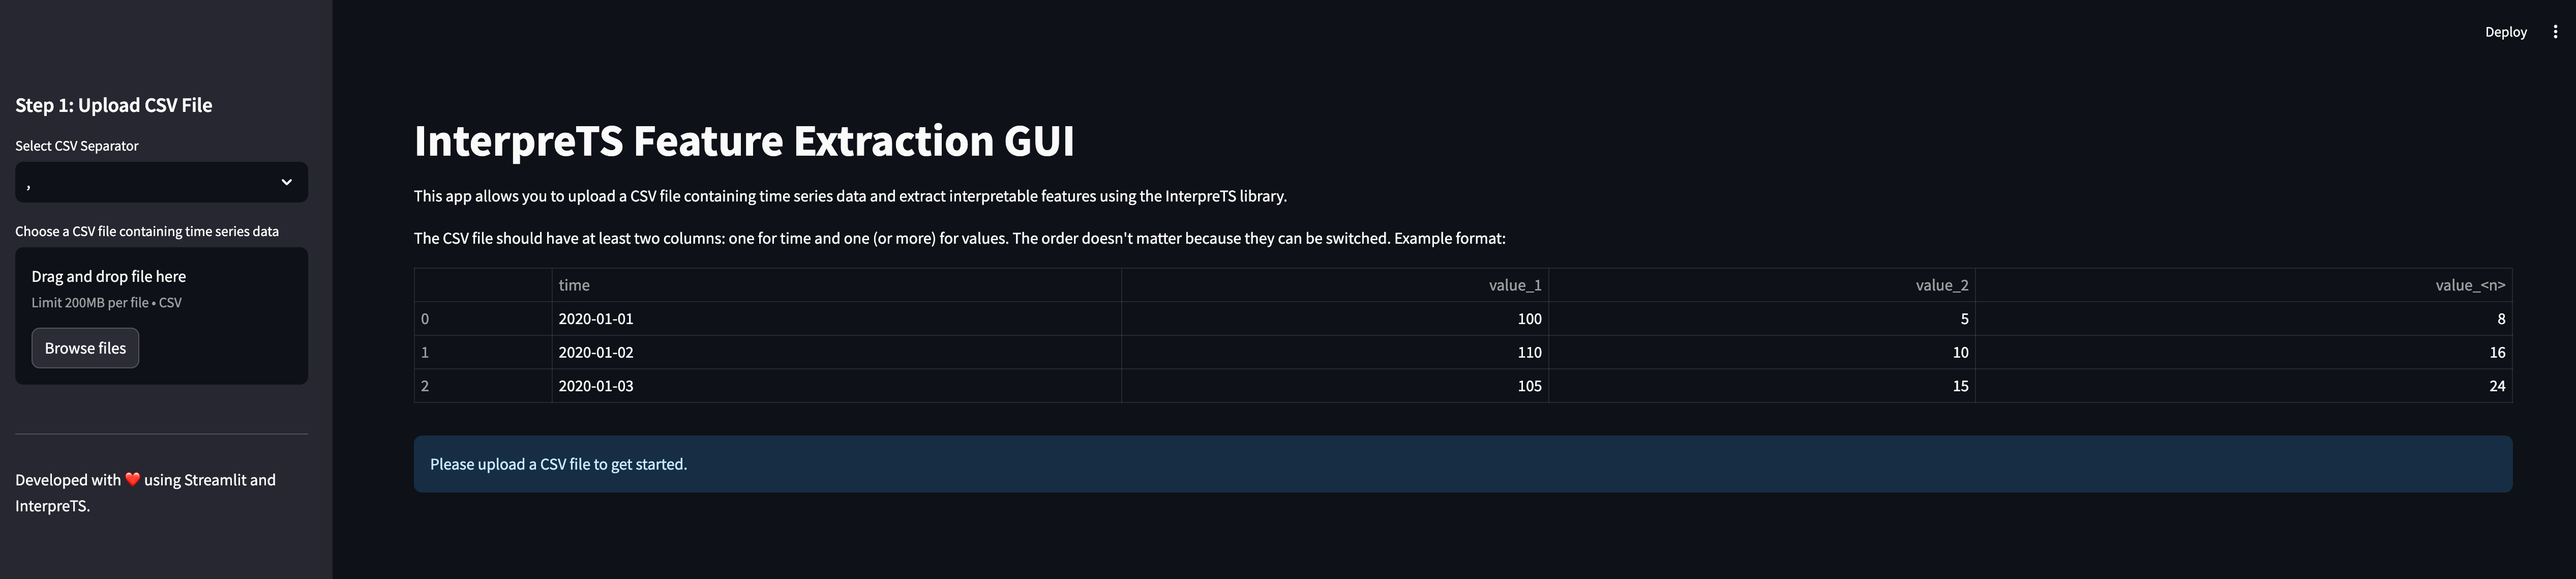
Sidebar: Use this area to upload CSV files, select columns, and choose features.
Main Window: Displays data previews, sliders for window/stride, and the extracted features.
Data Upload#
Uploading your CSV file and selecting the appropriate separator are the first steps.
Click Browse files in the sidebar.
Choose the correct separator (comma, semicolon, tab, space).
The data preview will appear in the main window.
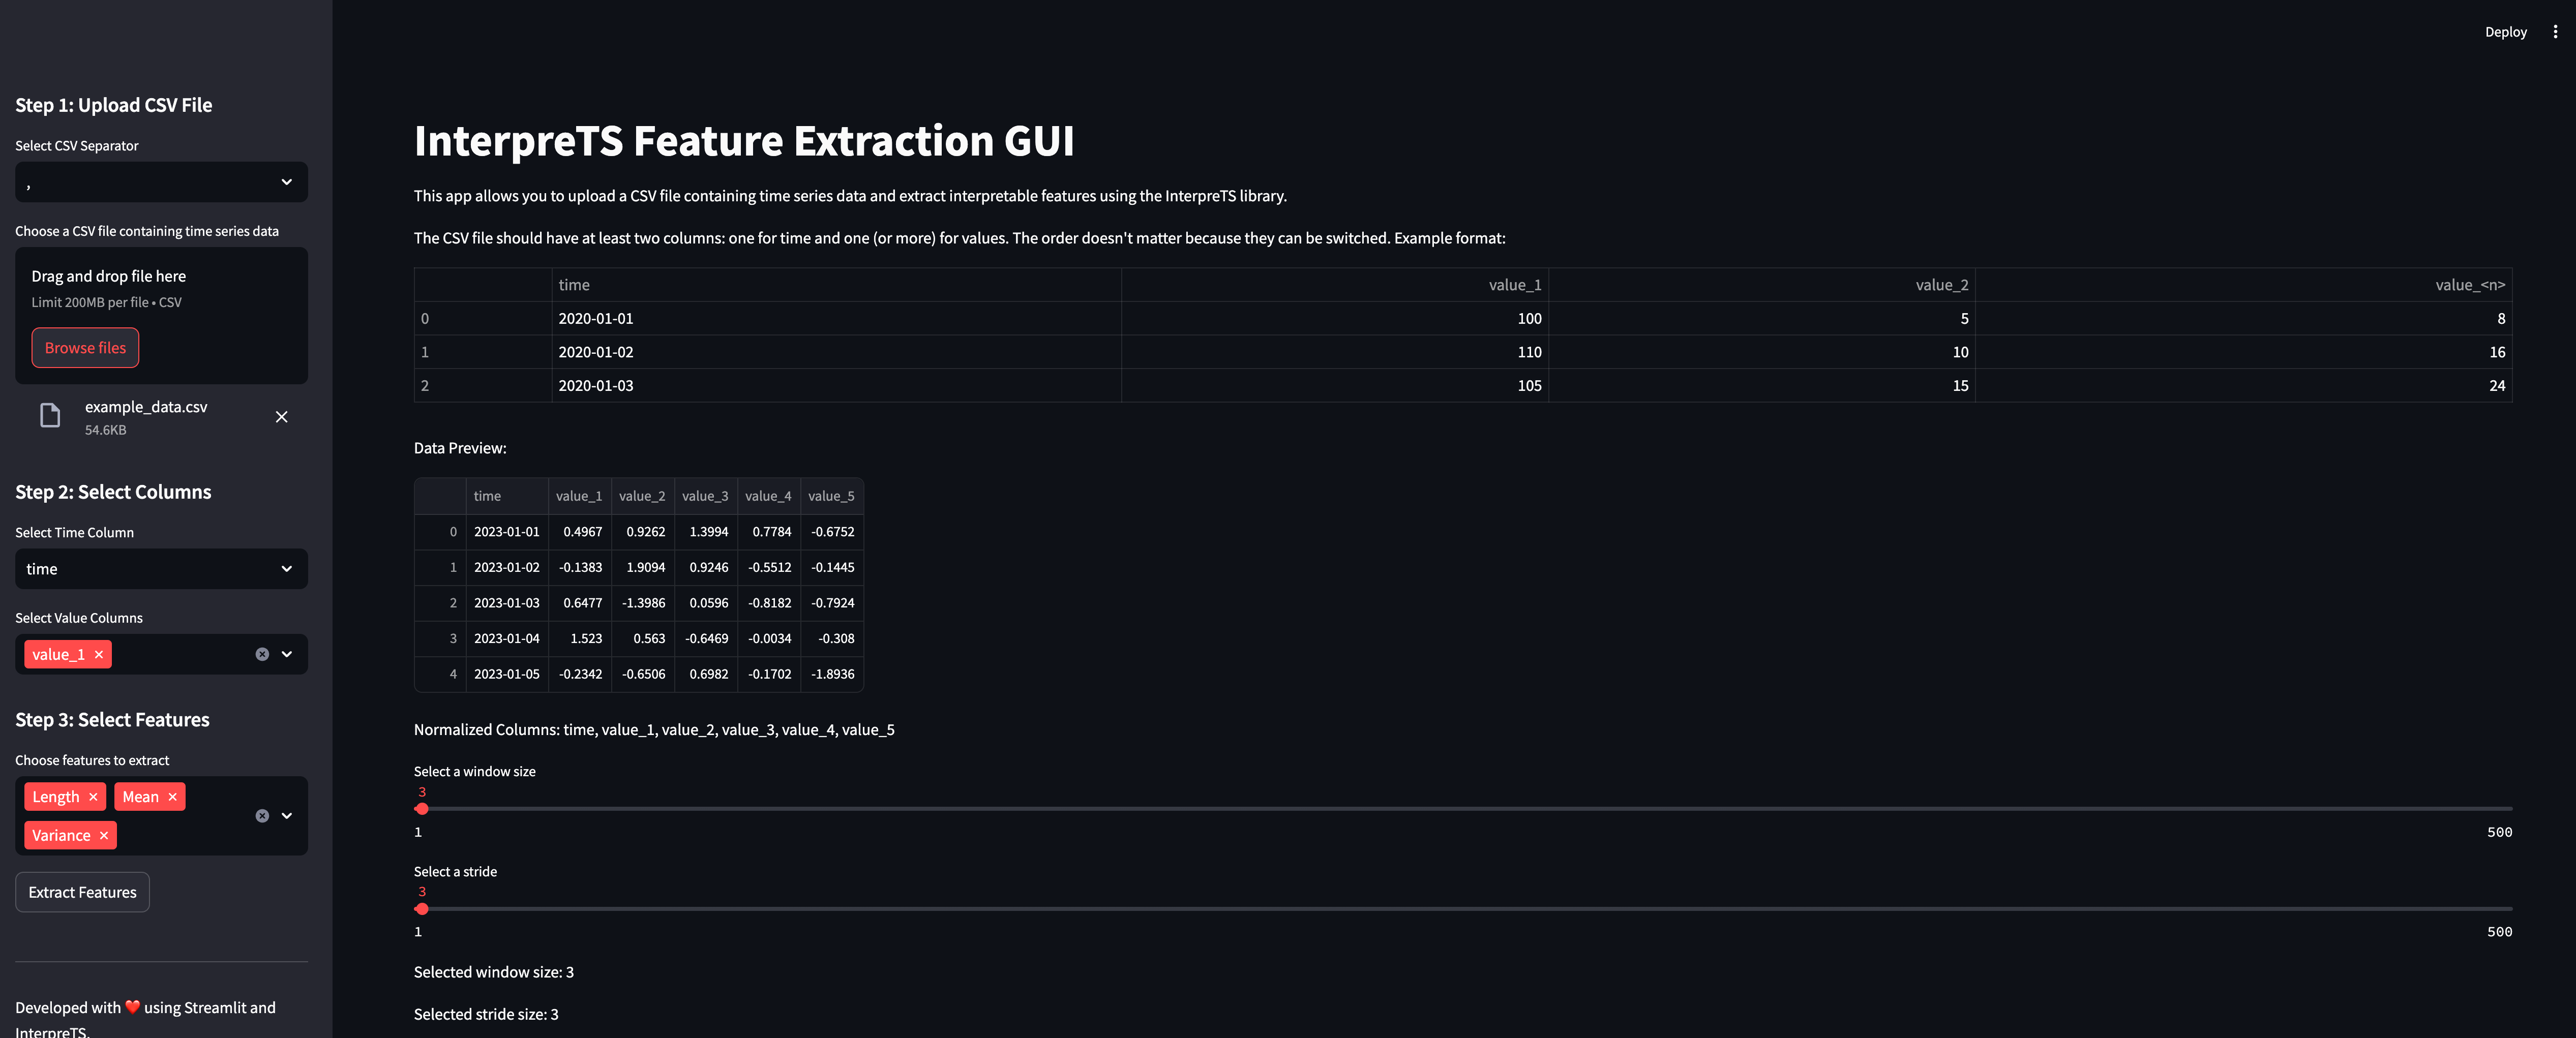
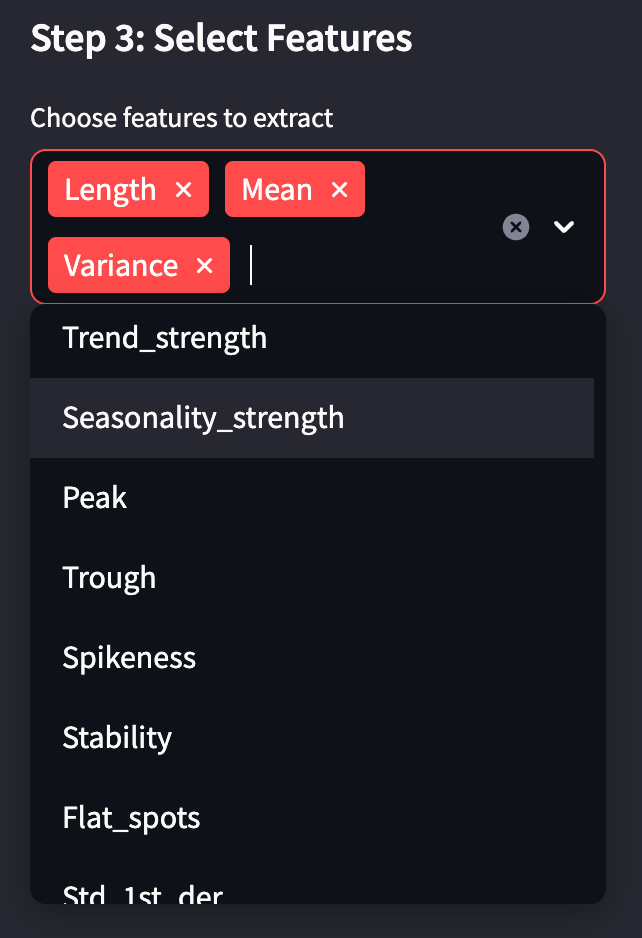
Feature Extraction#
After specifying your time column and value columns, select the features you wish to calculate.
Pick the Time column from the dropdown.
Select one or more Value columns.
Check the boxes for the features you want to extract.
Results Preview & Export#
Click on Extract Features to calculate rolling window metrics. A preview of your results will appear, and you can download them as a CSV file.
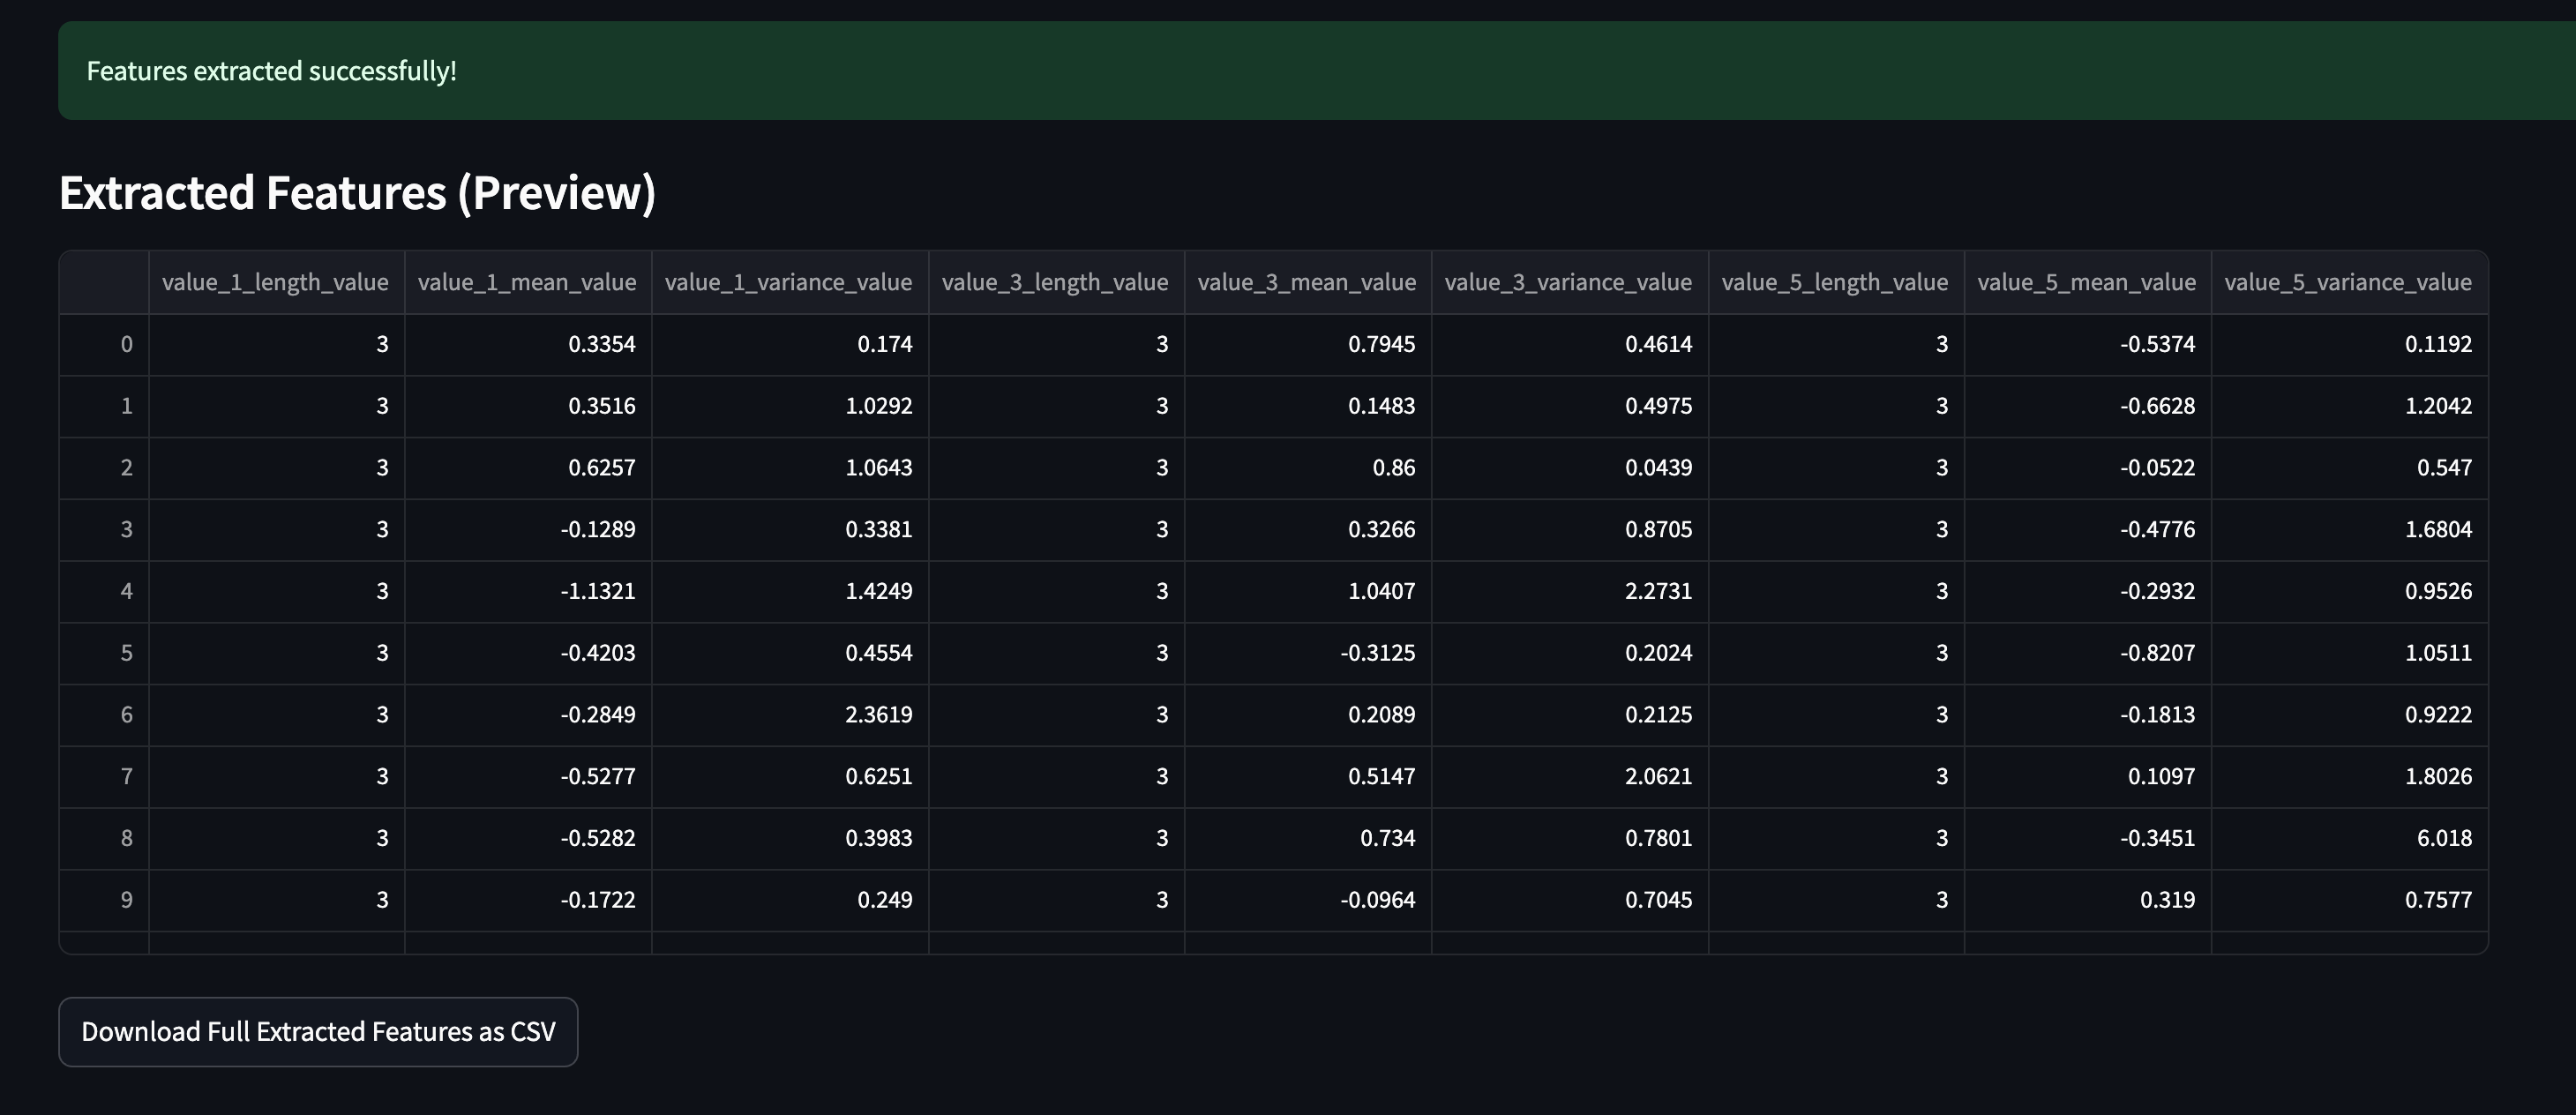
Review the first 50 rows of extracted features in the main window.
Click Download Full Extracted Features as CSV to save the entire dataset locally.
Additional Tips#
Experiment with different window sizes and strides to capture various time-series patterns.
Use the progress bar to track the computation status for large datasets.
Keep your CSV files clean (no invalid or missing values in the chosen time column).